This week p-value made it to the Science news feed. The whole story started already in the middle of last year, when Bejamine and coworkers published in Nature Human Behaviuor a paper titled „Redefine Statistical Significance“. The group of some 80 scientists propose, that the major part of research studies should not be conducted at the significance level of 0.05 but at 0.005. They claim that this could be an efficient measure to increase the reproducibility of the scientific results. Now, Lakens together with ca 100 coworkers published a response in defence of assigning p-value = 0.05 as statistically significant. They argue, that this would increase tremendously the size of the studies. The studies would need to analyse far more data points or samples, would take much longer and of course would be much more expensive. The latter may result in a decrease of confirmative studies.
So why really all this fuss? Obviously, p-value is somewhat complicated to understand, students hate it and the scientist just like to state that the effects observed were significant. I personally was pretty much surprised by this topic popping up in the first place as it somewhat goes against my fundamental understanding about statistics.
So I try explaining the concept and the problems very shortly and what is the problem. First, usually when we do science we are looking into some differences or similarities. Unfortunately statistics allow us only testing if two or more things are the same and it does not allow us to directly test if our observations are different. Therefore, the whole concept relies on two hypotheses: the so called Null-hypotheses, that our observation is indifferent from something else. Let’s look in on the examples. So let’s say that we are investigating if the temperature within the last ten years is higher than is was between 1950 and 1960 in our hometown. So our Null-hypotheses is that the temperature from 2007 to 2017 is indistinguishable from the average temperature between 1950 and 1960. The other possibility, logically called alternative hypotheses, is that, the average temperature is not the same.
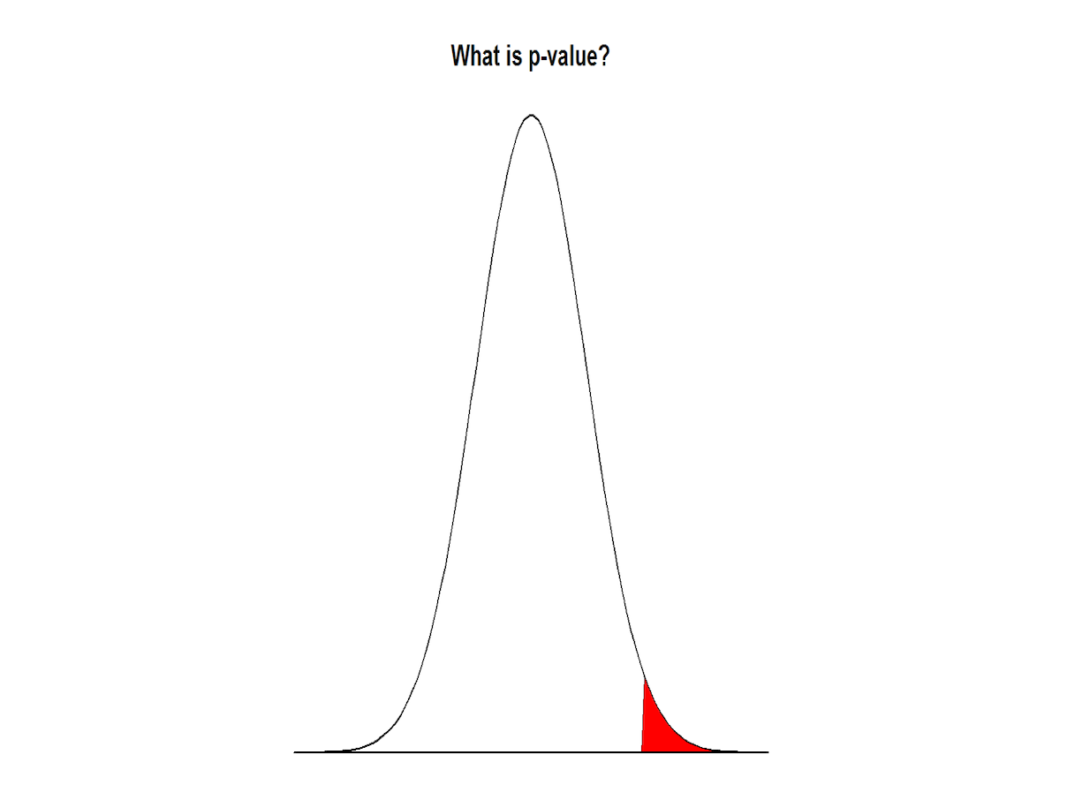
Now comes the p-value into play. Because of these random variations in our measurements caused by very-very different reasons starting from fluctuations in instruments up to sudden geological processes such as volcanic eruption the averages can not be exactly the same even if there is no real increase in the temperature. Therefore, we take into account the variation in temperature, called standard deviation, and conduct a suitable statistical test to reach a conclusion. However, due to these variations we are also not 100% sure in our average values and can only with some certainty say if the temperatures really are the same. p-value represents this certainty, or better yet uncertainty. For example, if we conclude that the temperatures are significantly different with p-value of 0.05 we actually mean, that even though we state, that T1 does not equal T2 it has a 5% change that they actually are the same. So from this perspective it would be better to use a lower p-value as an indication of significance. If we state something is significant at p-value of 0.005 (or lower) it means that we would assign a significant difference only to 0.5% of the cases where there actually is no difference.
However, the picture is not so simple. It also has a completely other pole. The p-value we talked above is associated with a so called false positive results. This means that in reality there is no effect but based on our test we would be claiming an effect. Still, it could also be the other way round. It can be that in reality the temperature is different between now and then but we do not reach this conclusion with our tests. This is called a false negative result. Unfortunately there is basically no easy way to assign a probability to such a false negative result. But one thing we know for sure is that if we decrease the probability of one type of error the probability of the other type of error will increase if the sample size is constant. Therefore if we really-really do not want to allow us being mistaken if we claim that the temperature now and then is different even if it is not, we have to realize that it becomes more likely, that we say that we conclude that the temperature is the same even if it actually is not. The only way to reduce both type of error is to increase the sample size, this is the main point of Lakens and the co-workers in the paper published this week.
But let’s look at another example. Say that we are trying to find a new drug for a disease. So basically the null hypotheses is here that the drug is as efficient as a placebo and the alternative hypotheses is that the drug has an effect compared to placebo. In reality there are two possibilities. That the drug actually has no effect and that it has an effect. The result of our analyses could also be either, that the drug has an effect or it does not have an effect. There is no problem if the drug really has no effect and we also say that that there is no effect. Also it is very much desired if our analyses conclude that the drug has an effect if it really does. However there are also two undesired possibilities. First, that we say that the drug has an effect if it actually does not have an effect. This is exactly the case we can describe with a p-value. So if we do not wish to label something as a drug if it is not a drug we should lower the p-value we assign as statistically significant and gain more confidence in this way. However, it is also possible that we state that the drug has no effect even though it actually does. This means, that we have lost a possible drug candidate due to our rigidness. As stated before if one error reduces the other increases at the same number of studies. So in one case we assign something as a possible drug that is not and in the second case we lose a drug that could be of use.
As we can not reduce both, the question now is, which is a worst possibility? It is obvious that there is no easy answer and in my personal opinion it highly depends on the circumstances. For example if you are in the beginning of the process trying to find a suitable drug, you most probably start with some computational chemistry approach to investigate which compounds at all could be reasonable. It is already well known that down in the next steps you will lose most of the possible candidates due to various problems. It is very likely that you do not want to lose a best possible drug already in the first step. So in this case you do not want to make a false negative decision. As we can not adjust the probability of false negative result itself we need to adjust false positive. So to lose as little as possible useful drug candidates but still not to test every single possible compound in the next stages we should adjust the p-value we call statistically significant reasonably high, for example to 0.10.
Now, let’s look a situation if one of our drugs that we selected in this first step has made it through a punch of other trials and we are about to undertake some of the last trials. Last trials usually need human experiments, take extremely long time and are followed by enormous costs. This means that we do not want to put all this time, effort and money into testing some compound, that is not very prominent. This means, that now we need to be very sure that the drug really is about to work. Meaning that we want to reduce the false positive risk and this time should observe as small as possible p-value to be certain, that the yet-to-be-drug actually has an effect.
These are the main reasons why there can and should not be a fixed p-value that we call statistically significant and it should be adjusted each time depending on the aim of the study. Even more so, it is much better to report the original data and the probability of false positive calculated from the data in addition to stating the author’s conclusion. This would allow readers comparison with their data and independent evaluation of the data.