Last week of November I and Louise participated in a two-day NTS workshop on analytical techniques and implementation followed by a two-day NORMAN network‘s annual meeting in Odense, Denmark.
NORMAN interlaboratory comparison of semi-quantification methods
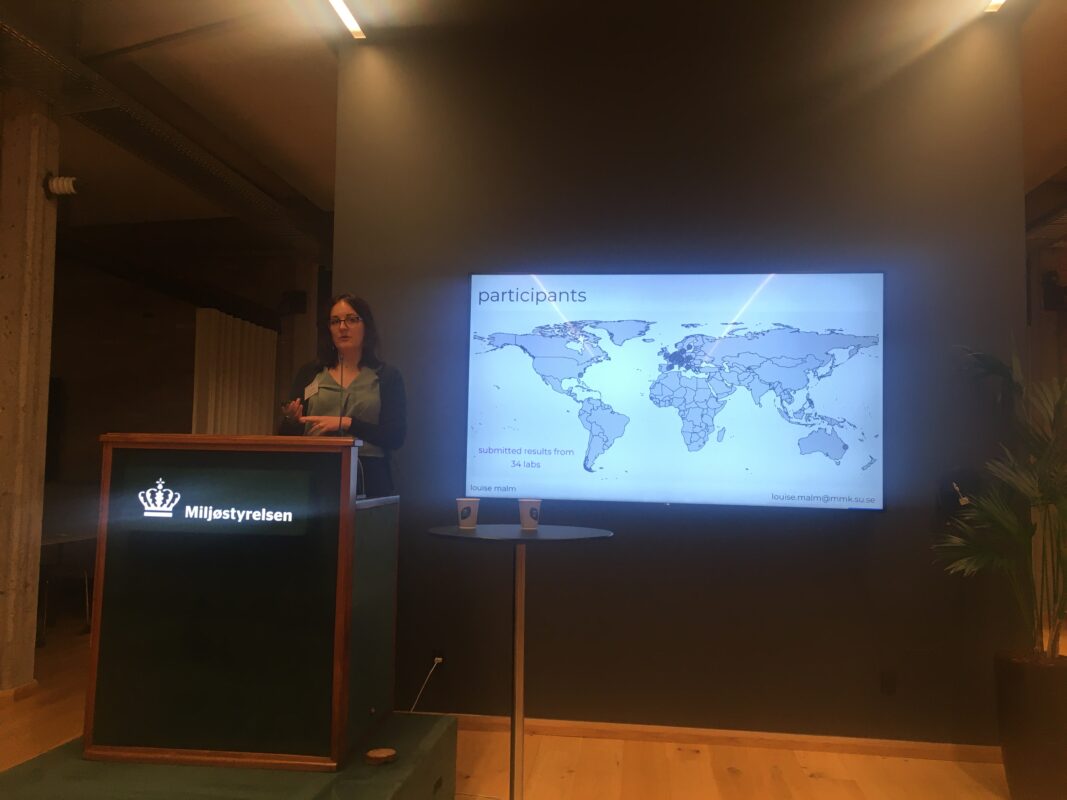
We presented the quantification strategies for the LC/HRMS nontarget screening together with a first glance at the results from the NORMAN interlaboratory comparison of quantific
ation methods for NTS. This interlaboratory comparison was a Joint Program Activities of NORMAN network in 2020; however, as many other activities the interlaboratory comparison really took off after the lockdowns. Forgive me for saying it, but actually, the delay turned out beneficial. In 2020 Louise, then a BSc student joined my lab and has been leading the NORMAN interlaboratory comparison ever since.
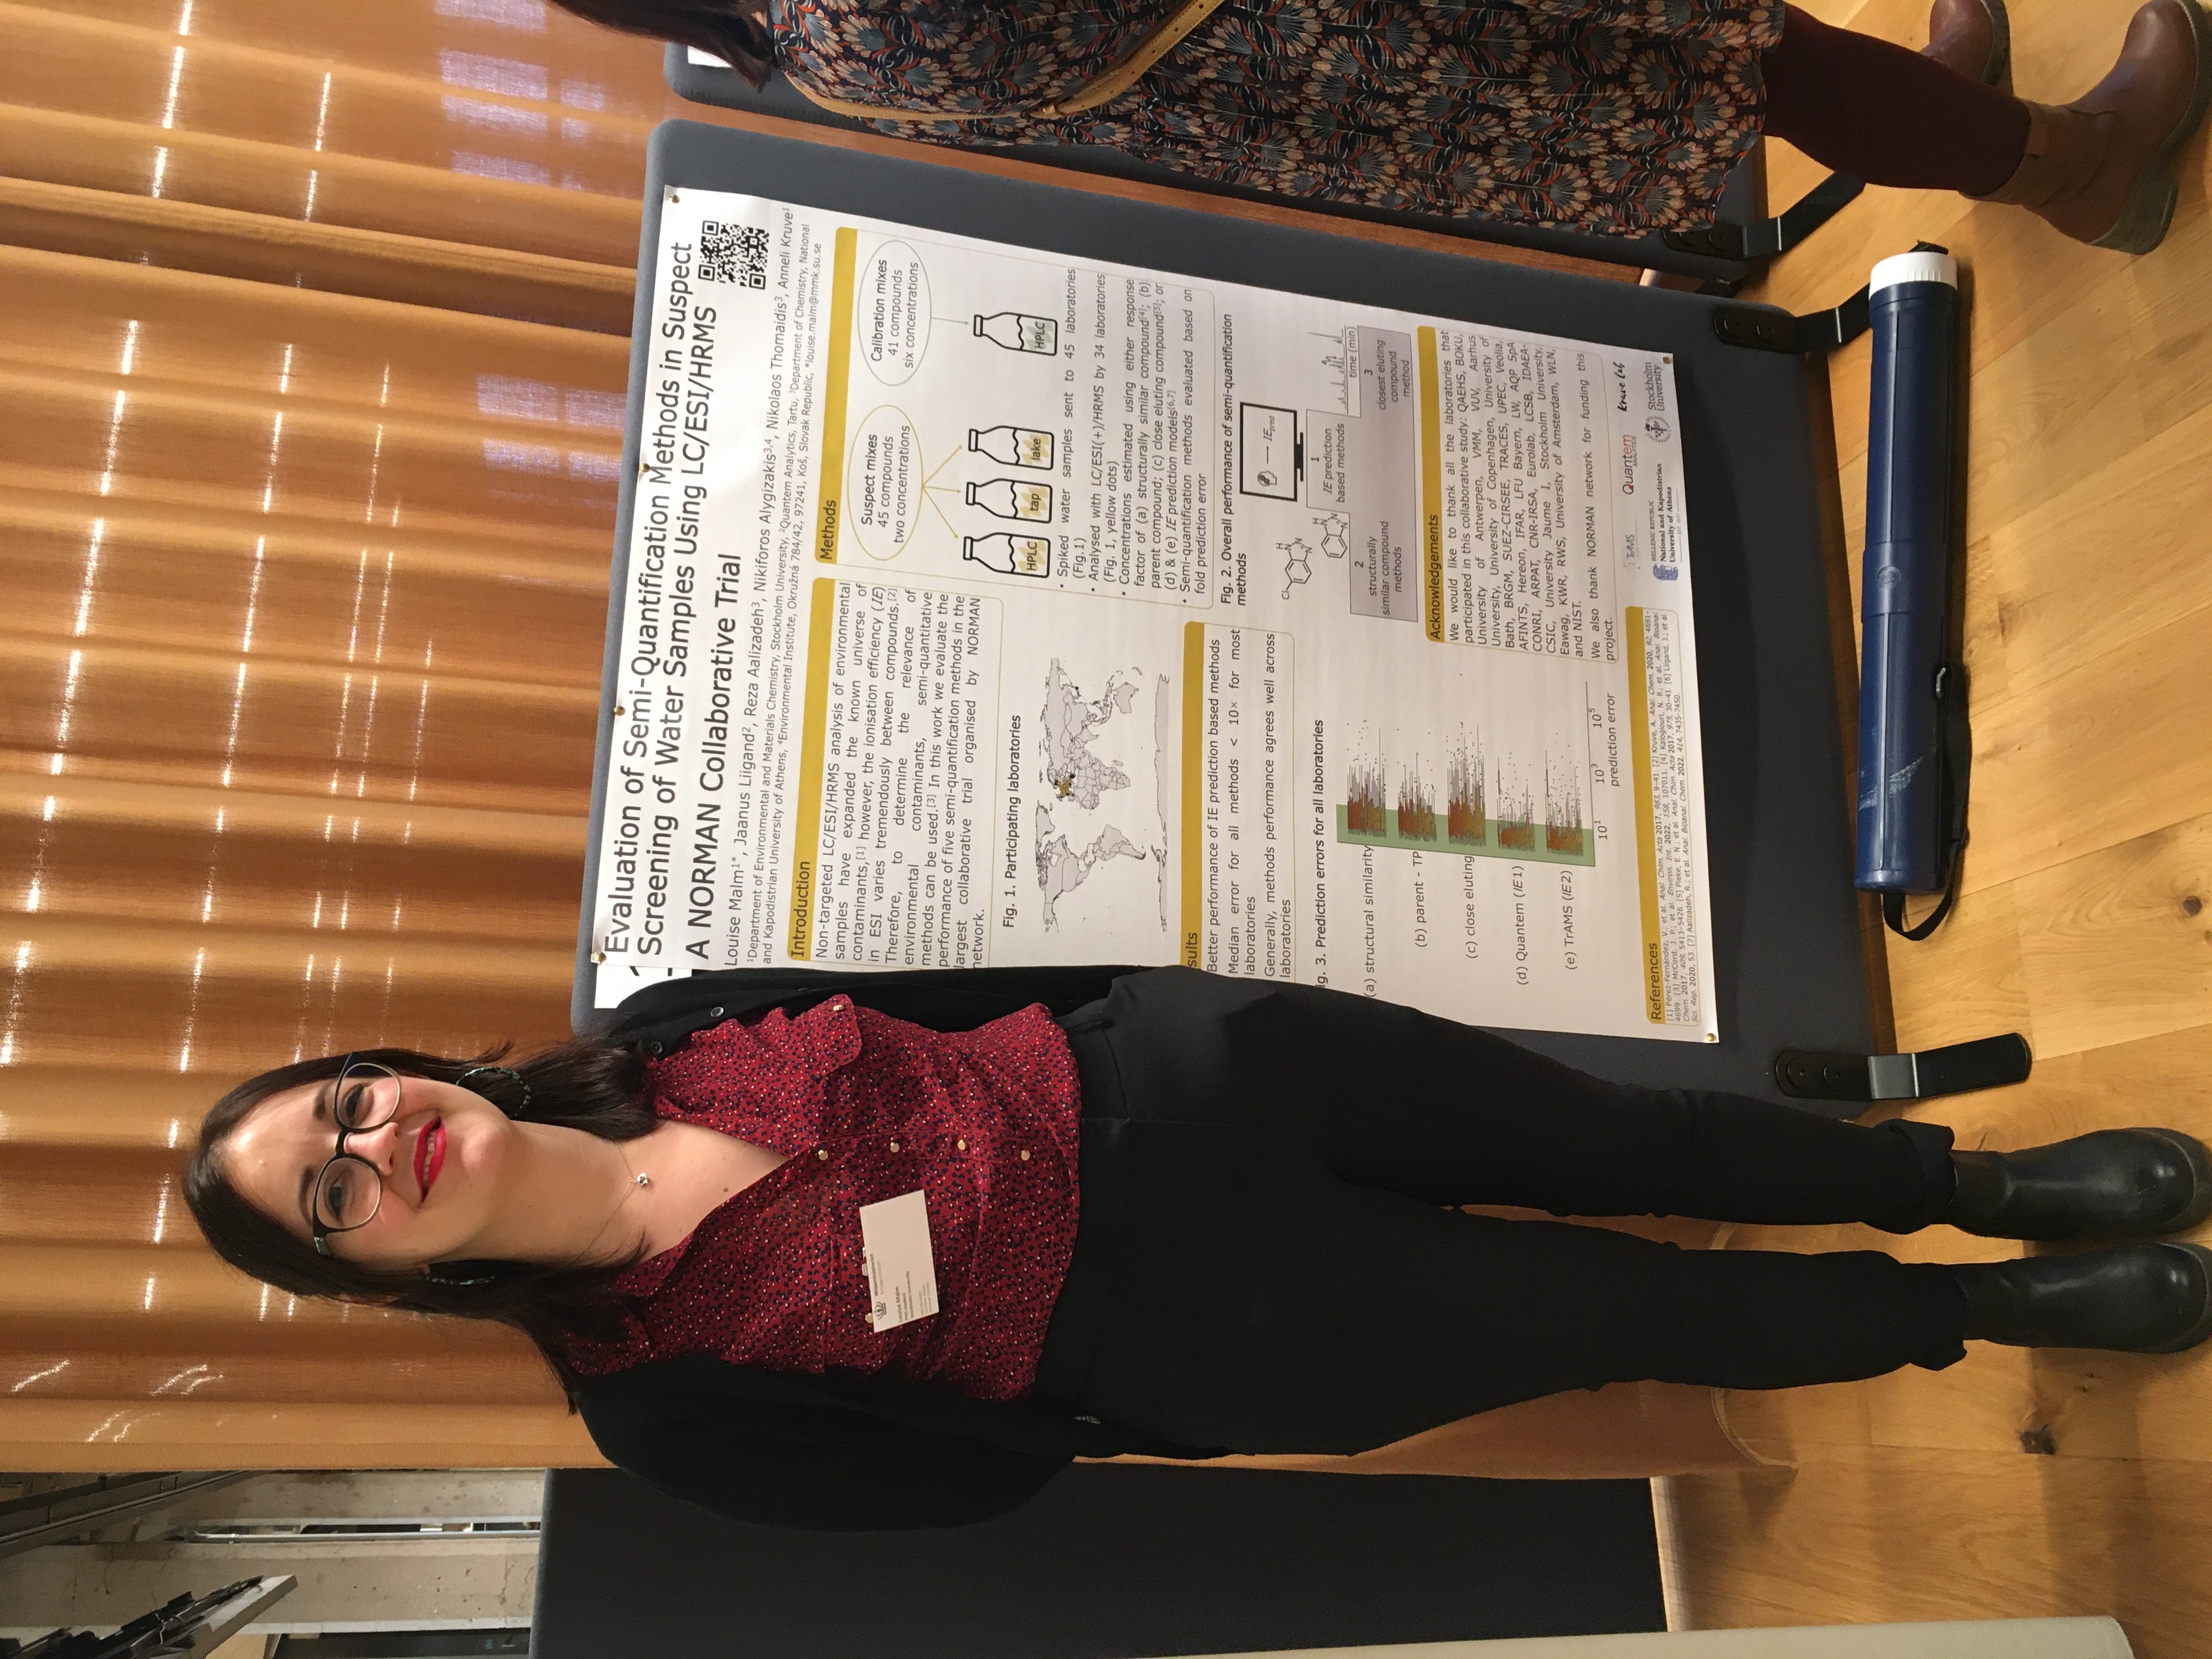
The samples were sent to the labs in late October 2021 and reached the labs (mostly) by the 1st of November. Each lab received six solutions with 41 chemicals with known concentrations and additionally six samples with known chemicals but unknown concentrations. The samples were HPLC grade water, tap water from Stockholm, and surface water from a lake nearby Stockholm, each spiked with 45 suspect chemicals at high and low concentrations. All samples were paired up with a blank sample.
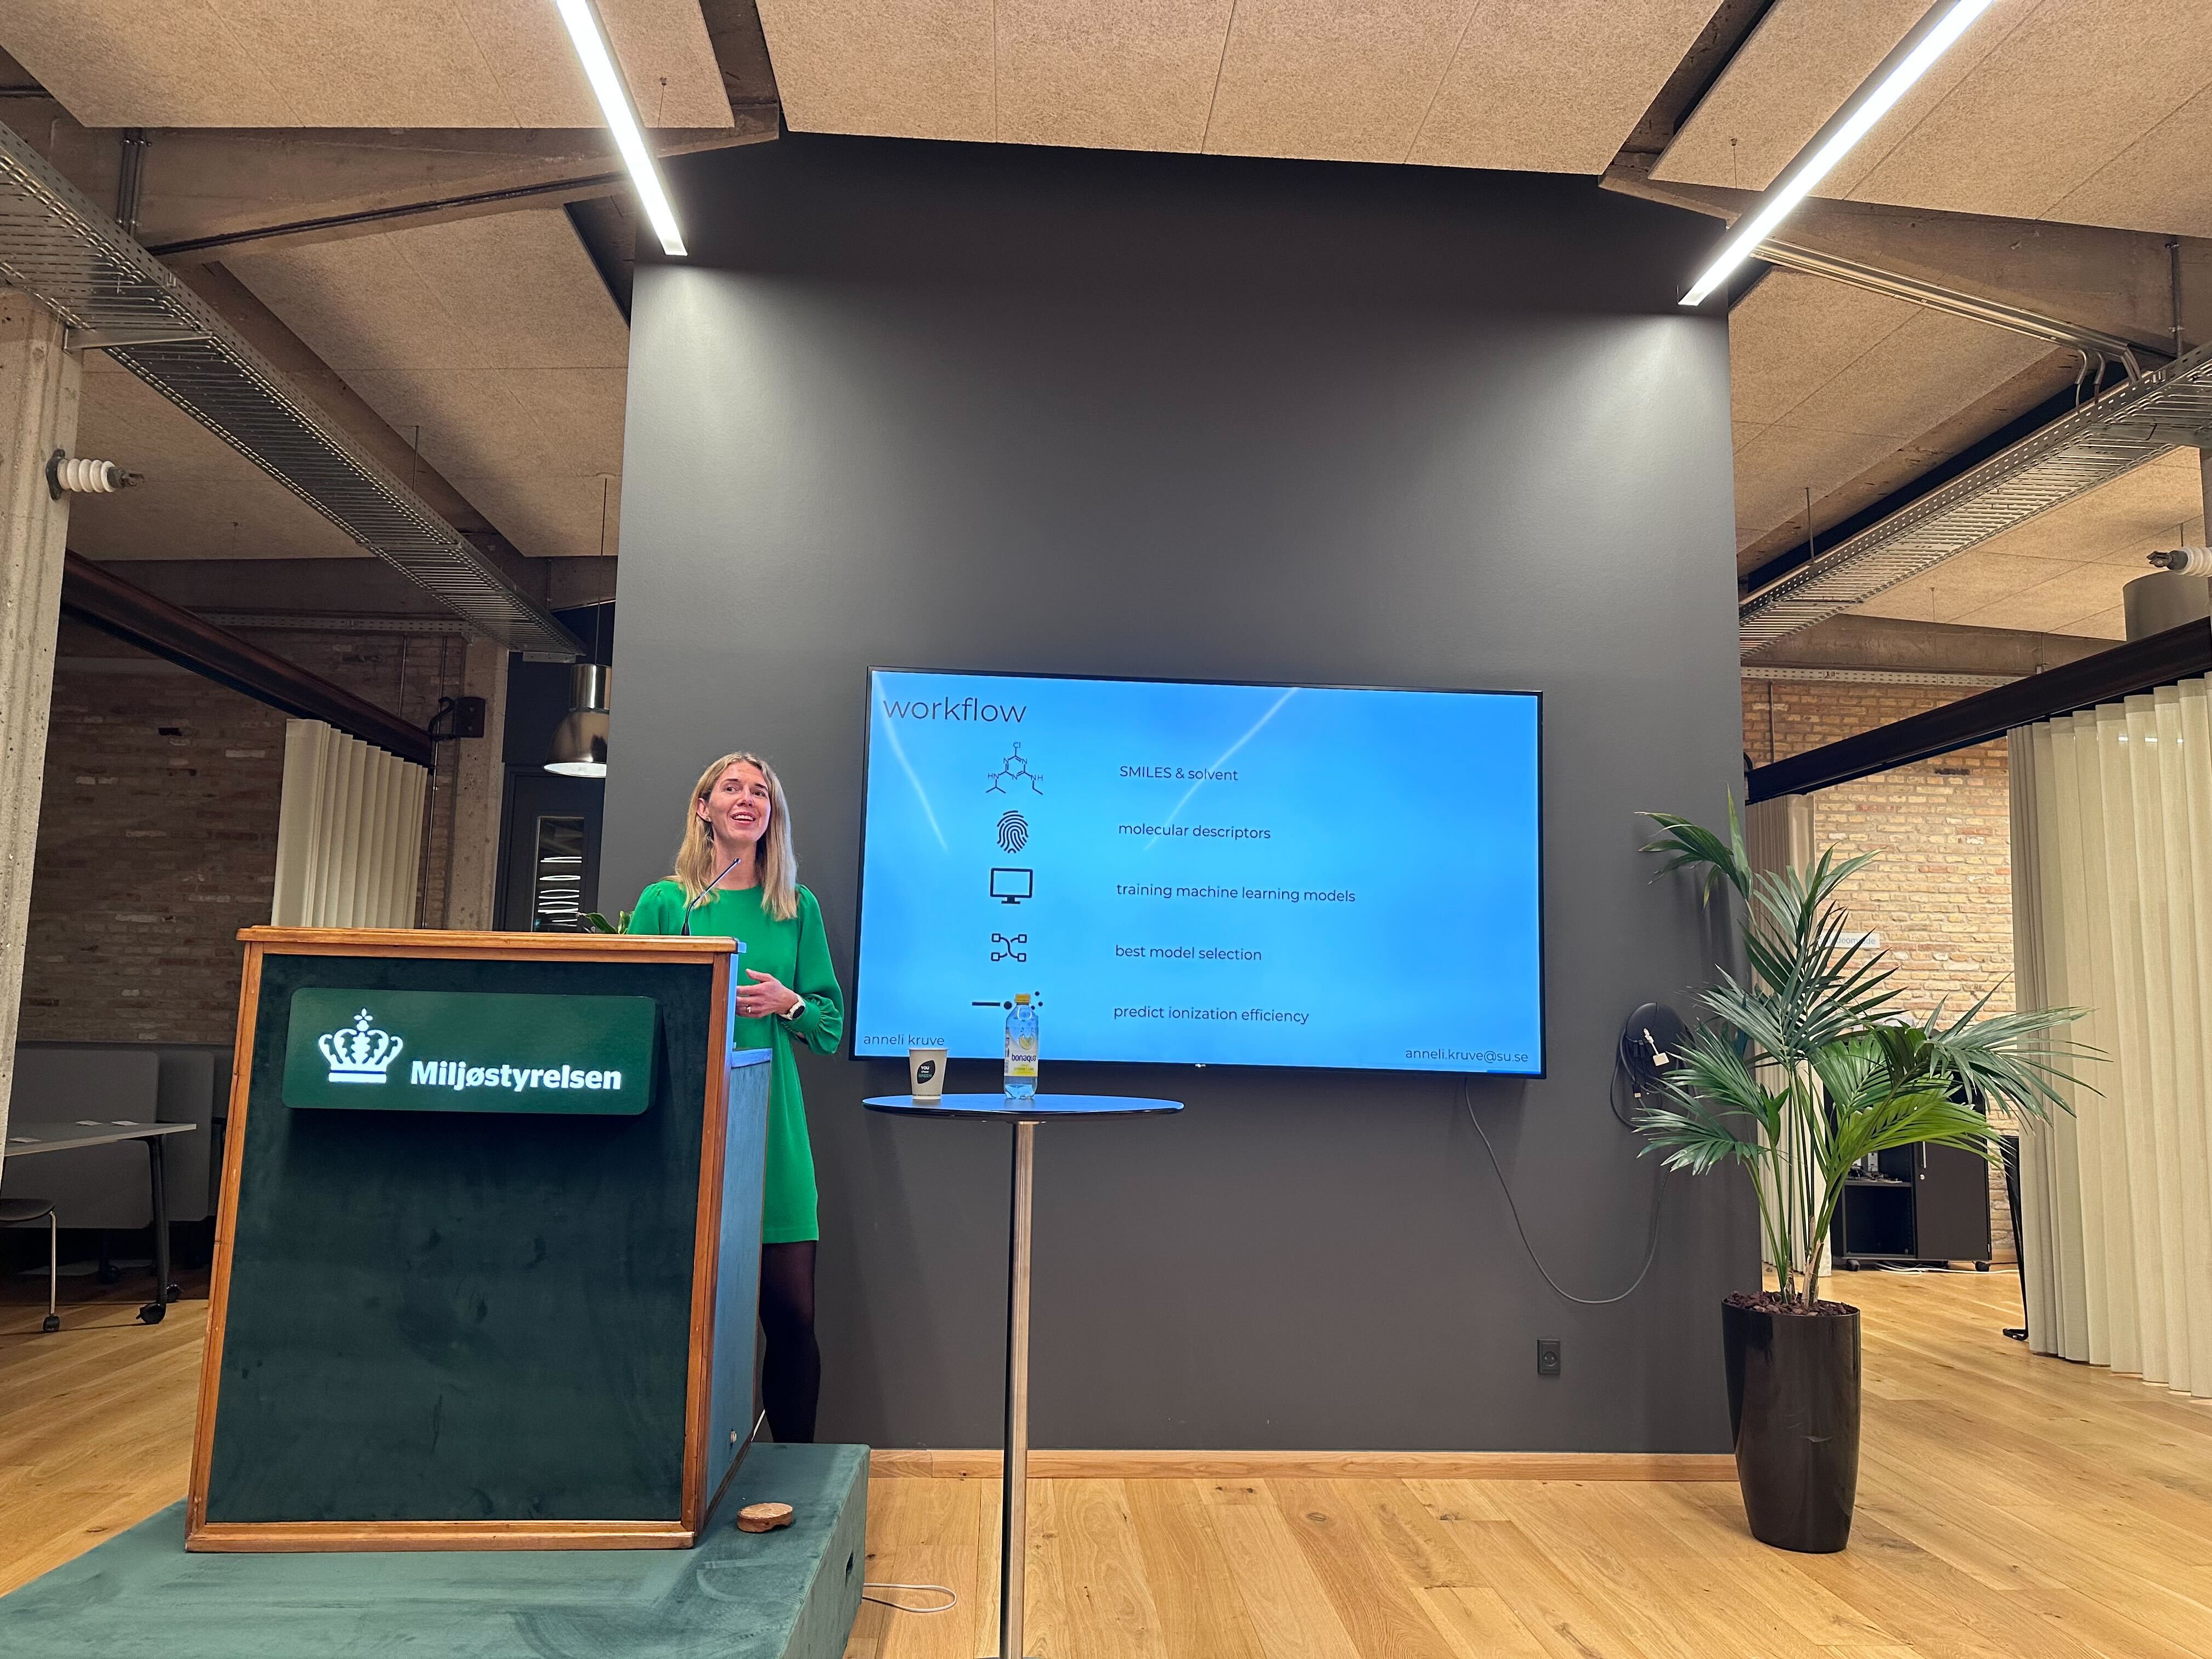
The calibration solutions were used to quantify the suspect chemicals in the samples. After the analysis of the samples, each lab applied (1) a structurally similar chemical approach (parent-transformation product as well as Tanimoto similarity); (2) a close eluting chemicals approach; and (3) an ionization efficiency prediction approach (Liigand et al. and Aalizadeh et al. available from Quantem and TrAMS, respectively) to quantify the suspect chemicals. The results from the quantification as well as the raw data files were then submitted back to us. By now we have processed the concentration data submitted by the labs and were able to see the very first trends in the results. The next step for us will be to reintegrate the data from all labs to assure that the data processing workflows are as uniform as possible. Each lab will also be informed of results particular to them. We plan to submit the results for publication in the summer of 2023.
Trends in nontarget screening
In addition to quantification in nontarget screening many other topics were discussed, such as Digital Sample Freezing Platform by Nikiforos Alygizakis, retention time predictions and other tools for structural annotation by Tobias Schulze, and many more. On the second day of the workshop, the focus was on using nontarget screening results in a regulative context. Importantly, we were happy to learn that in addition to Sweden regulators are increasingly asking for nontargeted analysis or are happy to combine the targeted analysis with a nontarget analysis in other European countries.
The largest problem identified was the complication in communicating the results from the nontarget analysis. Schymanski et al. has already in 2014 suggested a five-level confidence system to describe on which level specific features detected with LC/HRMS have been structurally identified, where the highest level is a chemical confirmation with an analytical standard. The lower levels, which are all accompanied by uncertainty in the structure and concentration, are harder to understand and act upon. The discussions in the workshop identified the interpretation of the results as one of the largest complications in the application of regulatory decision-making.
The problems in the interpretation of the results are something that we have also observed for the quantification in nontarget LC/HRMS analysis, or if you will semi-quantification. Generally, people find uncertainty in the data very hard to understand and put in context. This further feeds an expectation to have as minimal as possible uncertainty, often +/- a few per cent uncertainty in
concentration is imagined as a desirable uncertainty. In reality, this is not feasible even in targeted analysis when all uncertainty sources are correctly and carefully accounted for. Seeing an uncertainty of a few per cent for analysis of a complex sample is usually an indication of an overly optimistic estimation that accounts only for the repeatability of the analysis but not for the losses in the sample preparation, matrix effect in LC/HRMS, etc. You can check out more about estimating uncertainty in chemical analysis from the MOOC course by University of Tartu. In the case of nontarget analysis on levels 2 and 3, the uncertainty in the concentration is much higher, possibly reaching an order of magnitude. In spite of this everyone in the meeting agreed that a concentration with a large uncertainty is much better than no concentration at all.
In conclusion, NTS has been and is moving fast forward. It seems that soon is coming time to pay more attention to (1) consolidating the different approaches that are currently intensively developed; (2) work on the conceptual level of data interpretation that would be easier to digestible for people who want to use the data but have not themselves produced the data.