How do you know which of the compounds detected in suspect or non-targeted screening is most likely to cause an adverse effect? Which is most toxic? Which is present in the highest concentration? Which is having a concentration close to a toxic endpoint? This is exactly what we are answering in our latest research in collaboration with KWR for The Netherlands.
Detection
In a collaborative project with KWR samples from two large rivers, Meuse and Rhine, in The Netherlands were taken three times a year. To evaluate which chromatographic conditions yield the largest coverage of the chemical space, the samples were measured with reversed-phase in both positive and negative ionization mode, with HILIC in positive ionization mode, and mixed-mode chromatography in negative ionization mode. Most features were detected with HILIC, 2053, while with reversed-phase 531 and 856 features in the positive and negative ionization mode were detected respectively.
Quantification
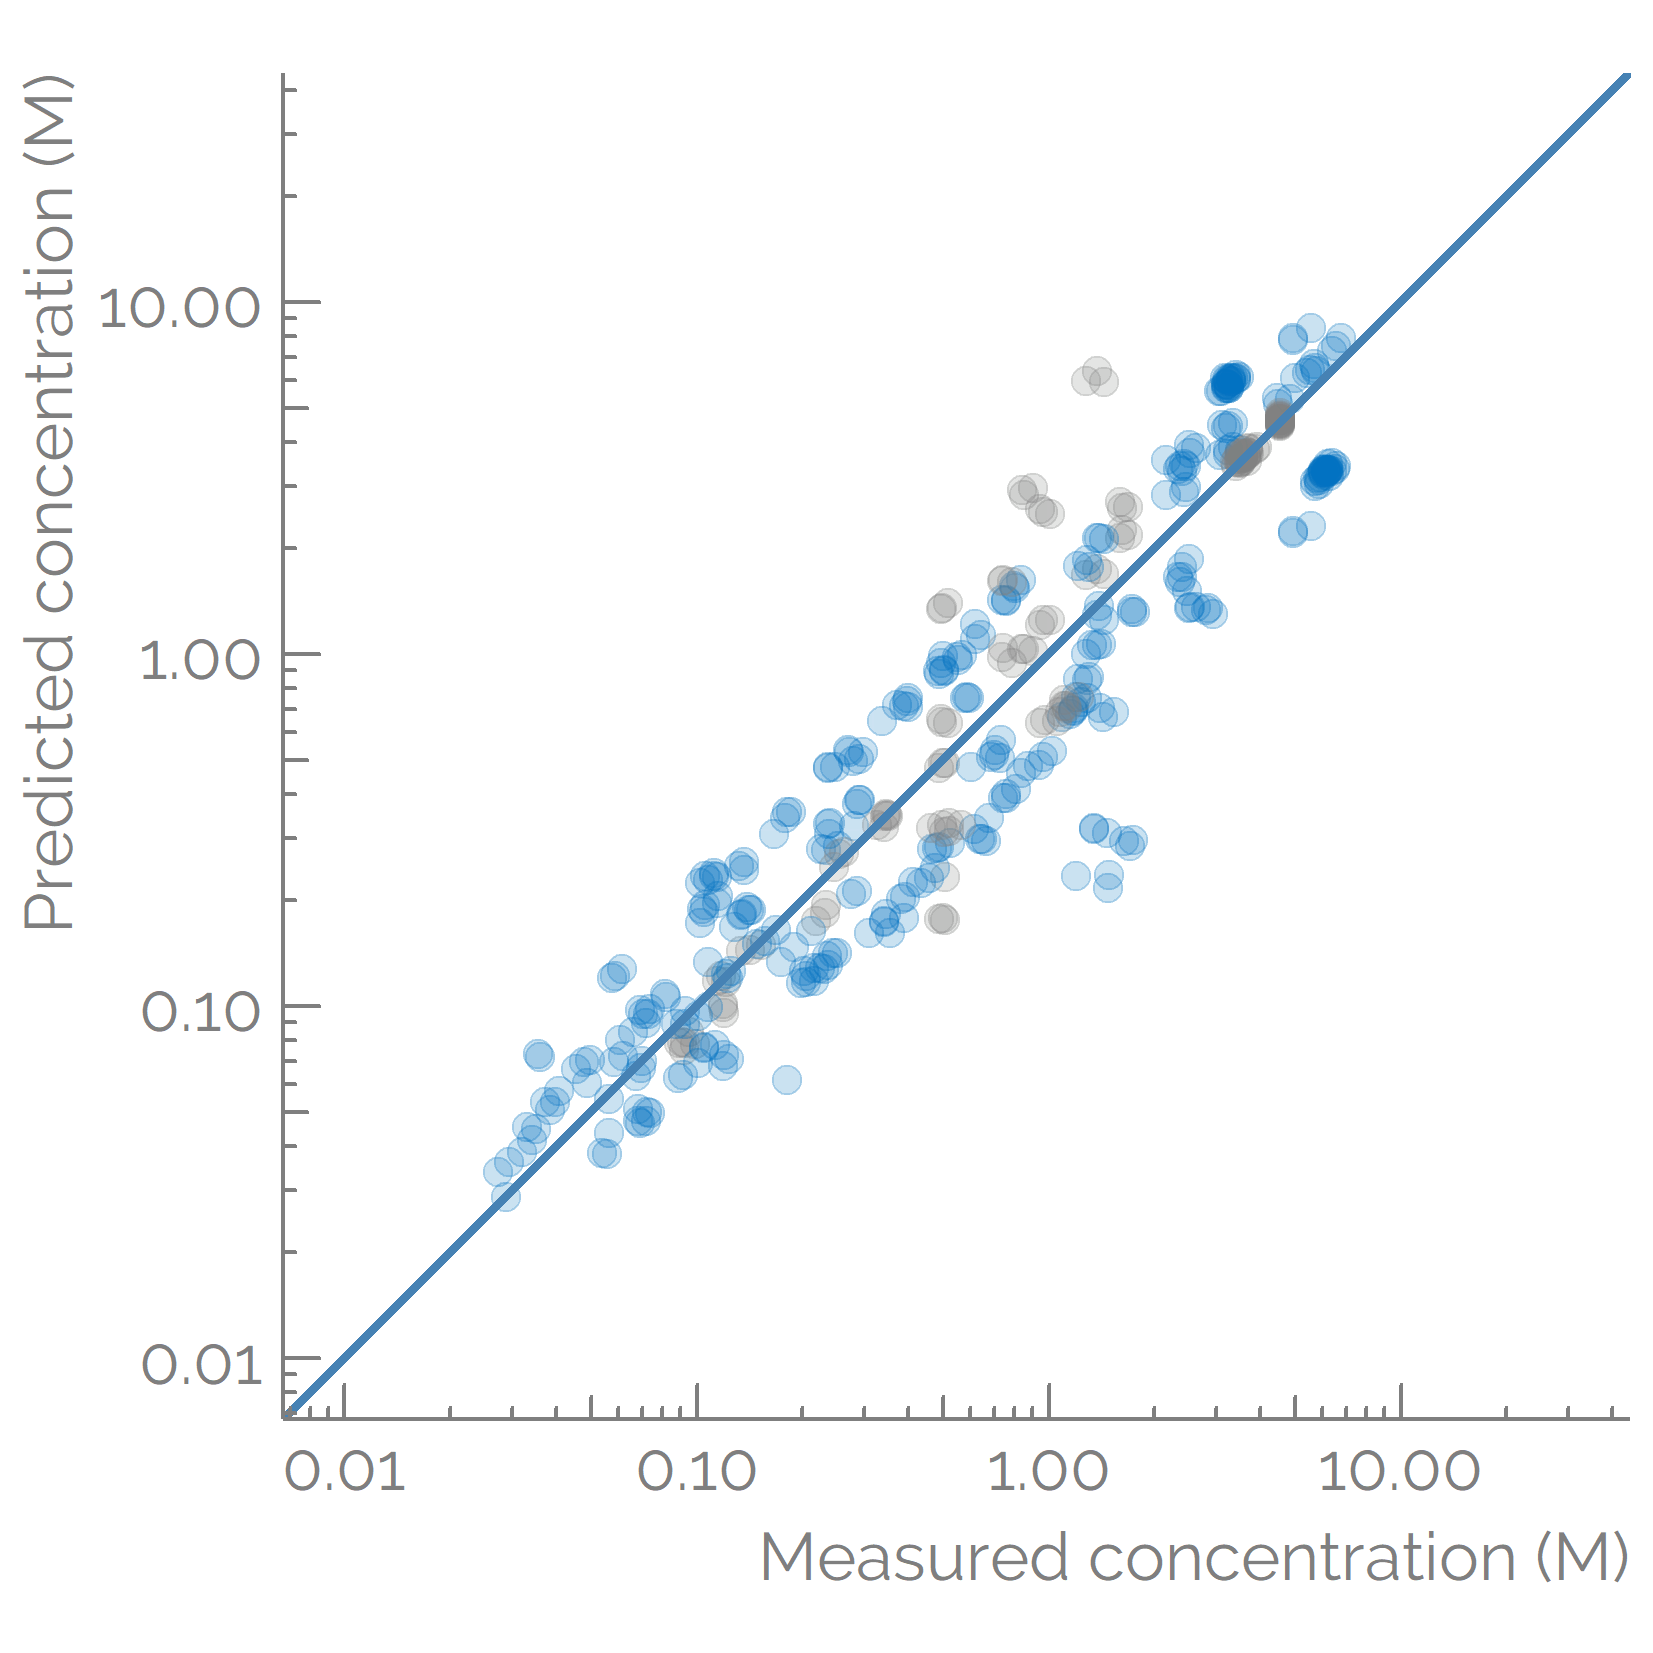
The detected features were matched with a suspect list and quantified to evaluate the exposure. An ionization efficiency-based quantification approach was used, where we calculated the ionization efficiency of all of the detected suspects in reversed-phase positive mode. Thereafter, the predicted ionization efficiencies were converted to the scale of LC-Orbitrap used in this study at KWR. For this, we used a set of compounds that were simultaneously quantified with targeted methods. The concentrations of these compounds were available from targeted analysis performed in parallel and were used to calculate the response factor. The experimental response factors of 6 compounds covering a wide retention time range (atrazine-d5, gabapentin-lactam, sitagliptin, 5-methyl-1H-benzotriazole, neburon, and caffeine) were correlated with the predicted ionization efficiency. The fitted linear regression was thereafter used to transfer the rest of the predicted ionization efficiencies to the instrument-specific response factors for the rest of the detected suspects. The concentration of the suspects was estimated by dividing the peak areas with the predicted response factors. The approach was validated by comparing the predicted concentrations for additional 22 suspects for which reference concentrations were also available from the targeted analysis. The concentration prediction error was 1.7x.
Prioritization
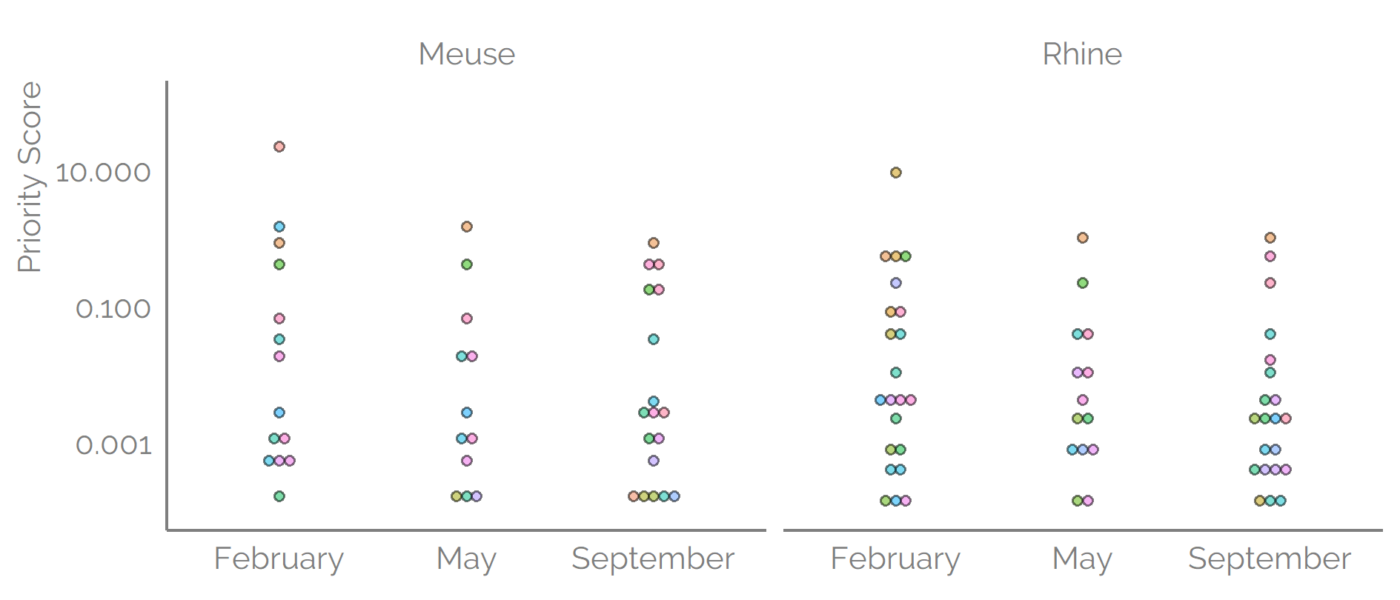
However, the risk is not only exposure it also depends on the toxicity of the detected compounds. To account for both of the components the toxicity data from ToxCast were combined with the predicted concentrations. The AC50 values were available for about 60% of the detected suspects. The Priority Score was defined as a ratio of concentration (exposure) to the 5th percentile of the water-relevant toxicity values. Higher Priority Scores indicate higher risk, where a Priority Score of 1.0 means that the estimated concentration is matching the 5th percentile of the AC50 values. Priority Scores for suspects detected with reversed-phase positive mode were a maximum of 308 for 1-ethyl-2-pyrrolidinone. Interestingly, the range of the predicted concentrations was somewhat narrower than the range of the AC5o values, 3 and 7 orders of magnitude, respectively. Therefore, the AC50 values influenced the Priority Scores somewhat more.
The future
The future application of the workflow could be included in the monitoring of water contaminants on regular basis. The two remaining limitations are (1) identification of the detected compounds that are not included in the suspect’s lists yet and (2) lacking experimental toxicity values for detected compounds.